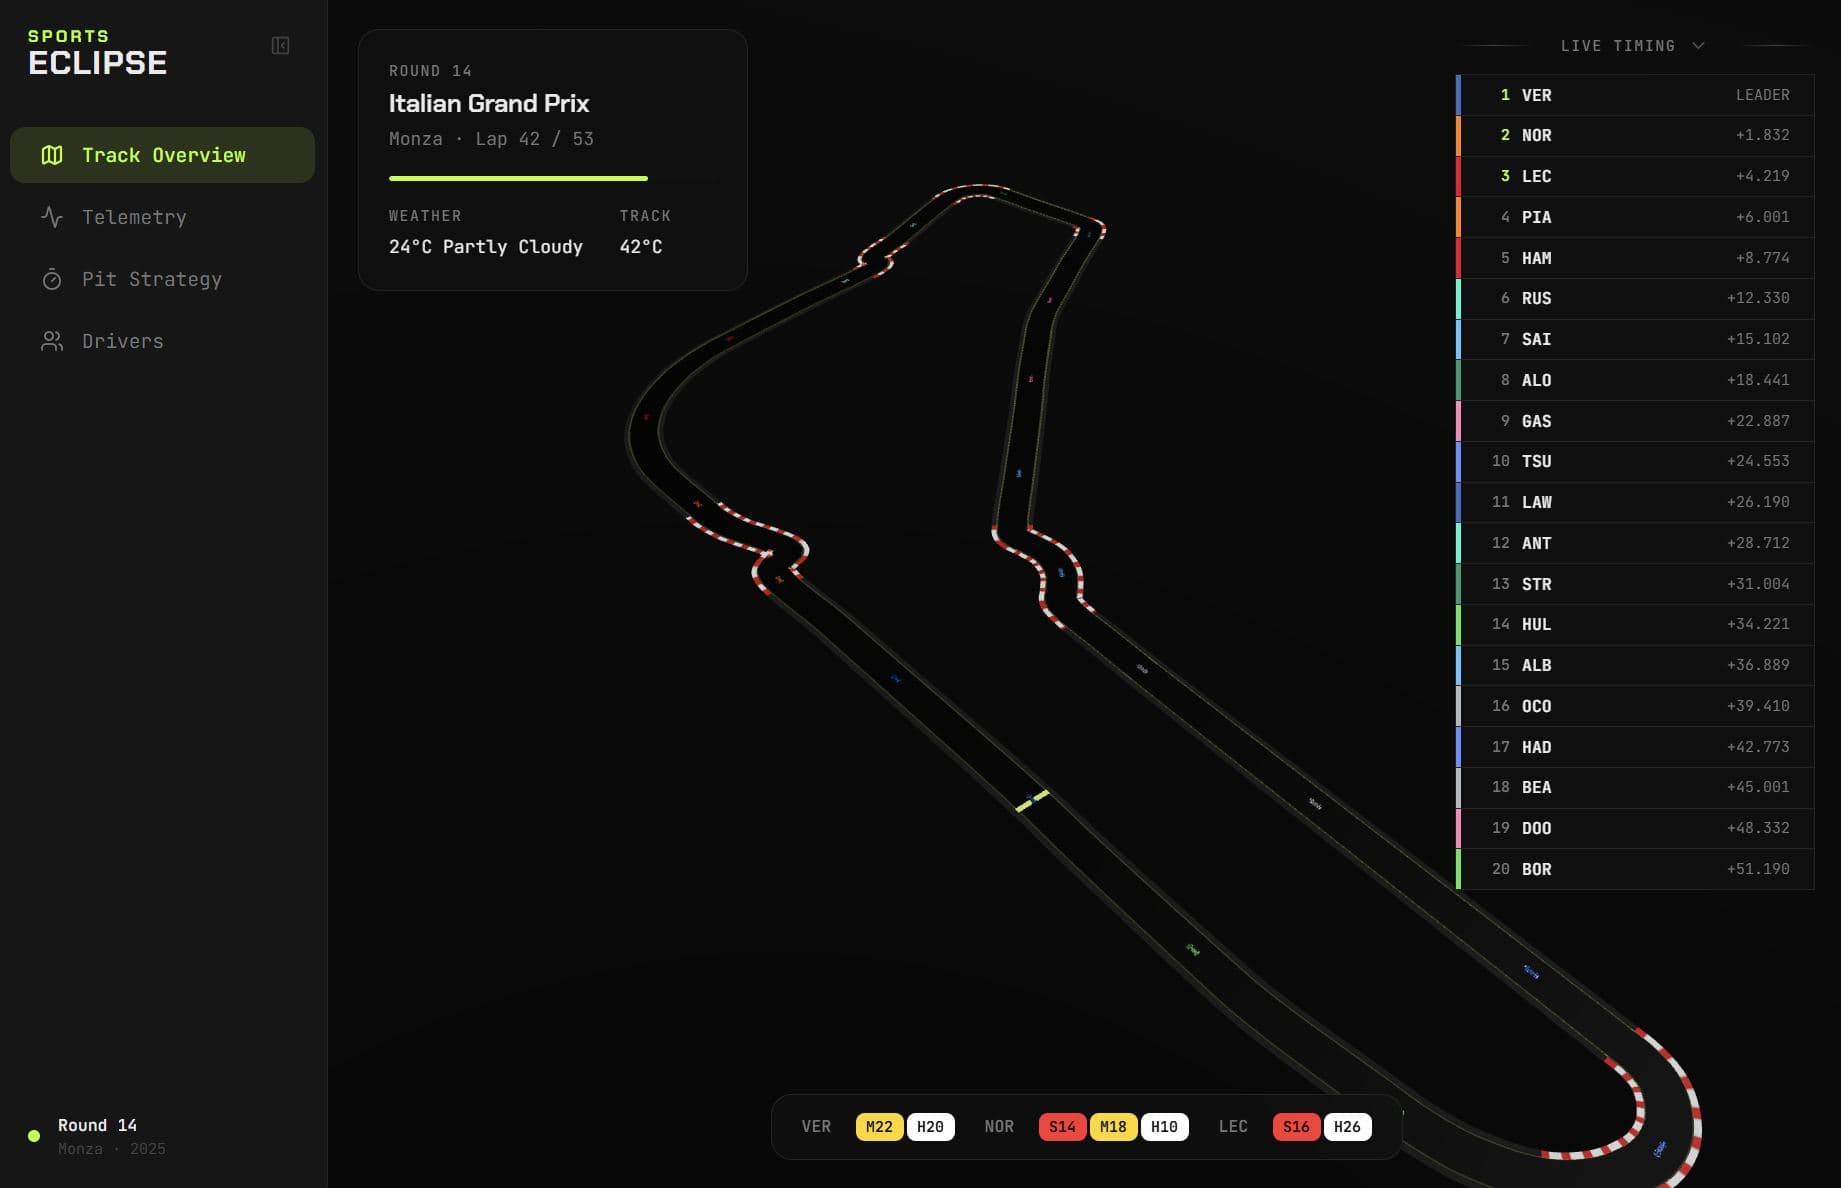
3D Monza track diorama with live timing overlays
01 / 03Sports Eclipse
Side Project · 2024
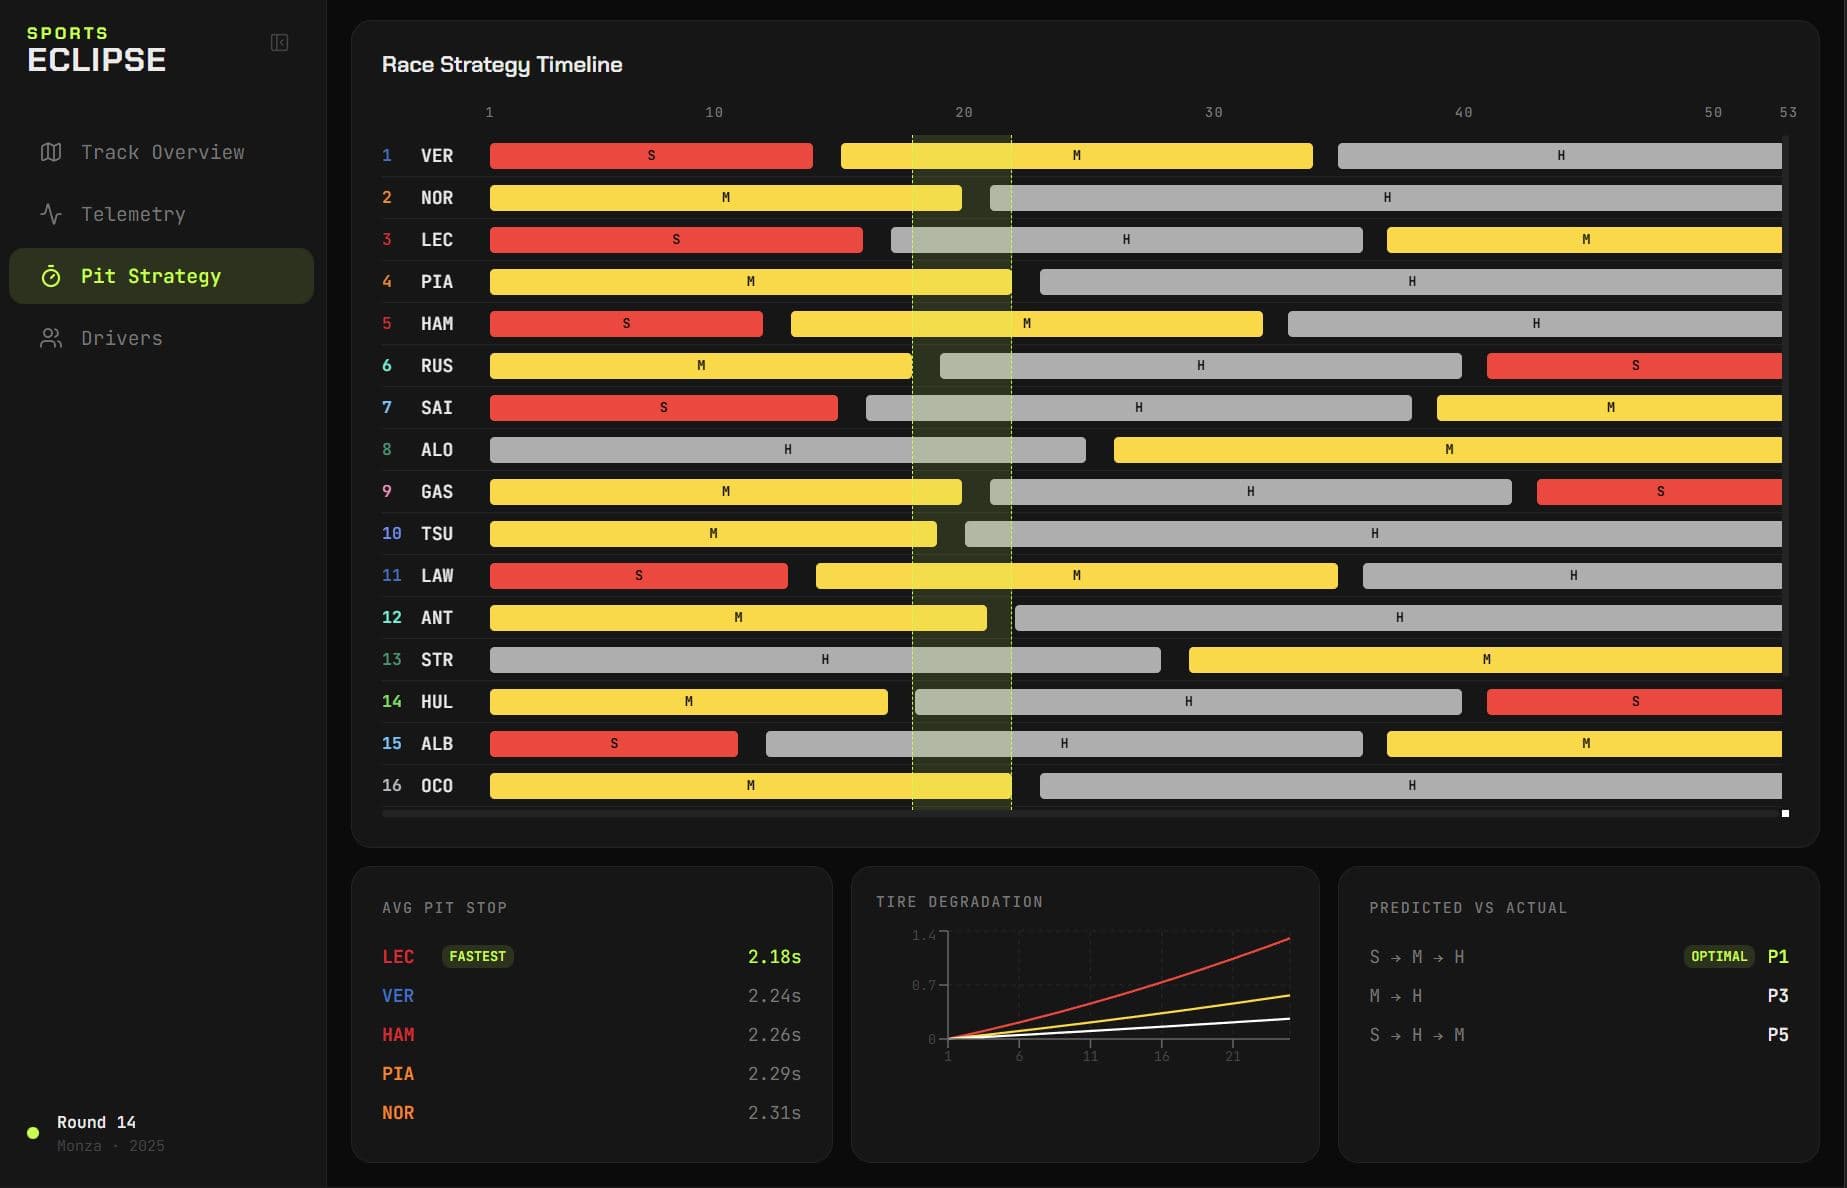
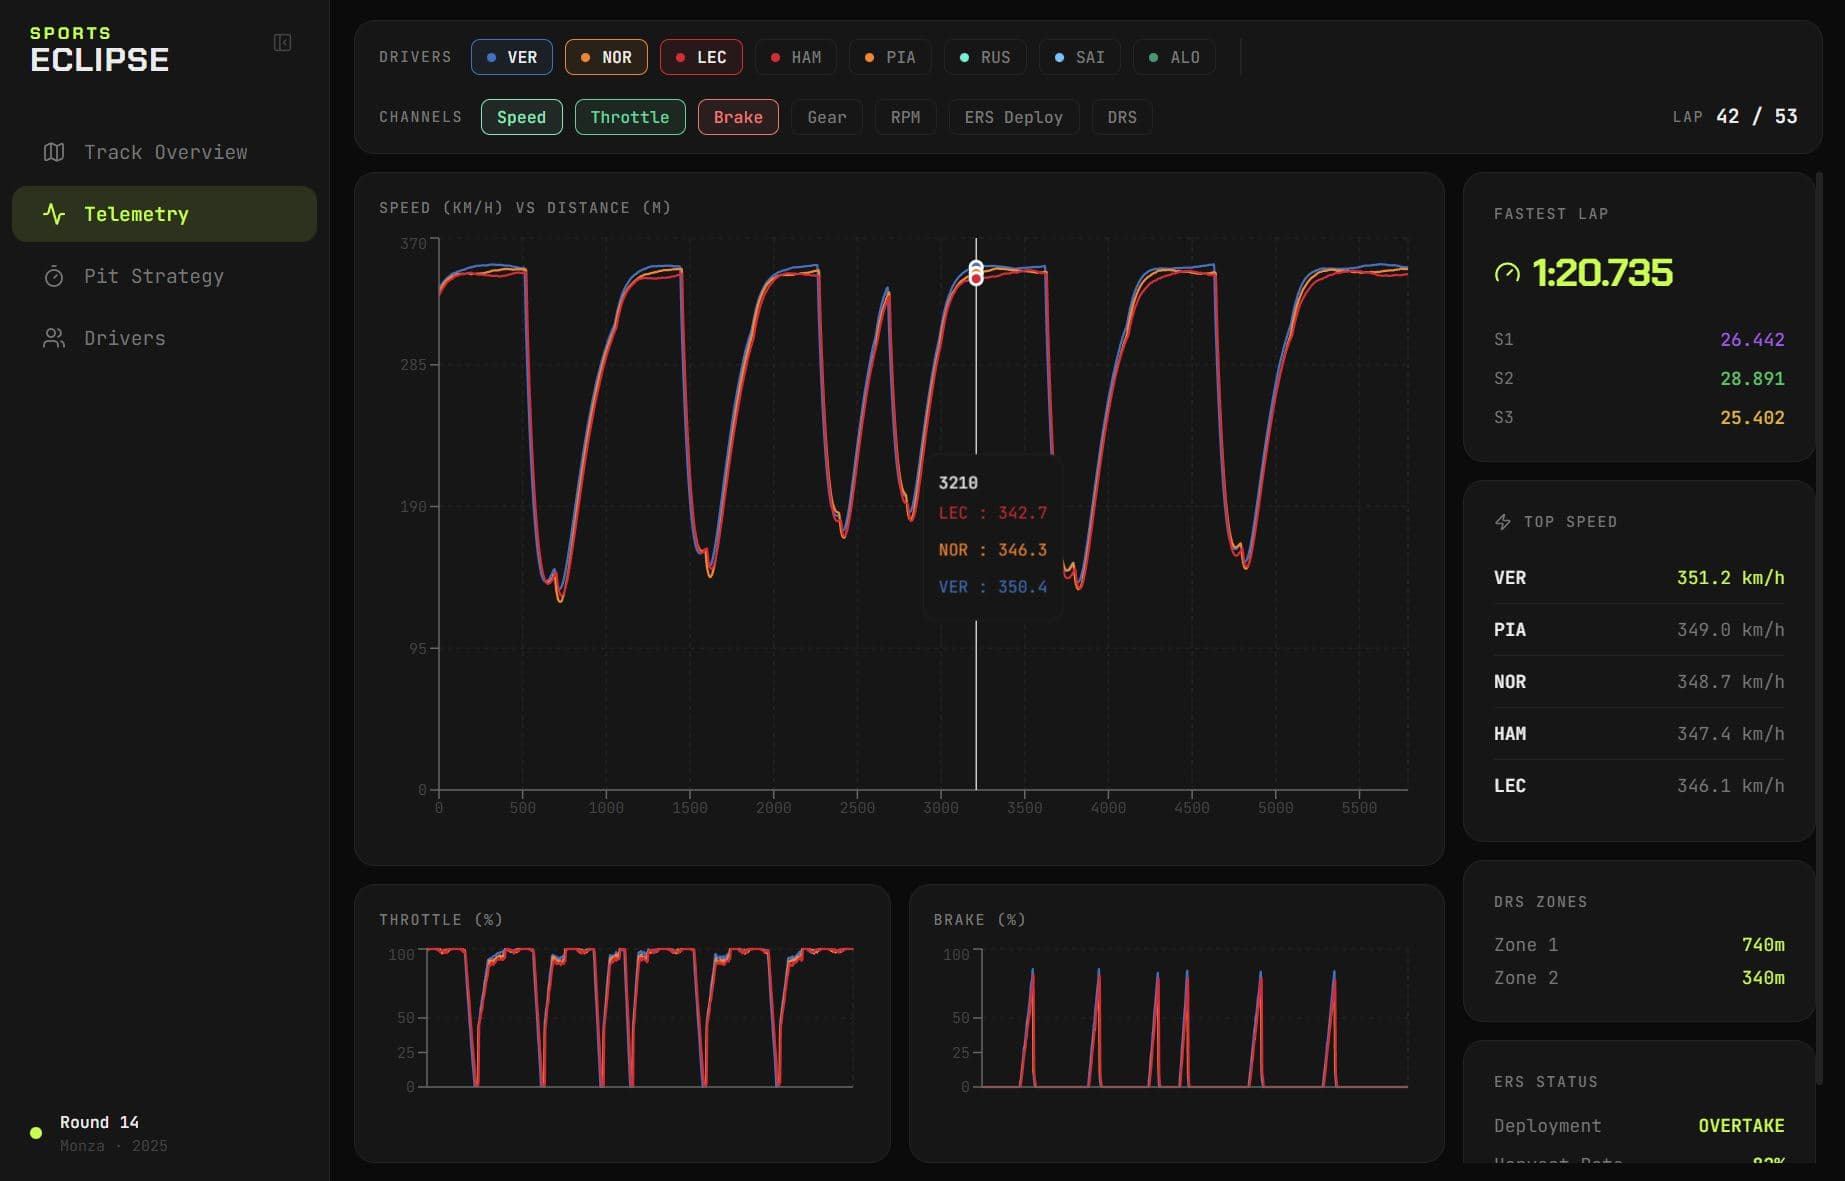
F1 analytics dashboard that gives you what the broadcast doesn't. 3D rendered track with cars positioned in real time, full telemetry breakdowns comparing speed, throttle, and braking across drivers, head-to-head driver comparisons, and a pit strategy view.
The pit strategy piece is the core of it. Trained a model on historical race data to predict the optimal lap to pit based on tire degradation, track position, and gaps. The prediction shows up as an overlay on the strategy timeline so you can compare it against what teams actually did.
Technologies
 React
React Three.js
 TypeScript
 PythonPyTorch
Skills
3D RenderingWebGLMachine LearningData VisualizationPit Strategy Optimization